Reviewing the report
In this section, you will learn how to review the results generated by the platform. Once you have uploaded an image, you will be automatically redirected to the Review report page, where you can see the results produced by the AI algorithm.
Structure of the report
When you open a report, you will see a box with the following heading:
As you can see, the report has three tabs:
- Lesion
- Follow up
- Clarifications
Each tab contains different information about results of the AI analysis. You can navigate between the tabs to access the information you need.
Lesion tab
Clicking on the Lesion tab will display the results of the AI analysis. This tab contains the following information:
- Global score: At the top, you can see the global Acne Lesion And Density INdex score. This is the combined score derived from both facial images. This is the most important score to monitor.
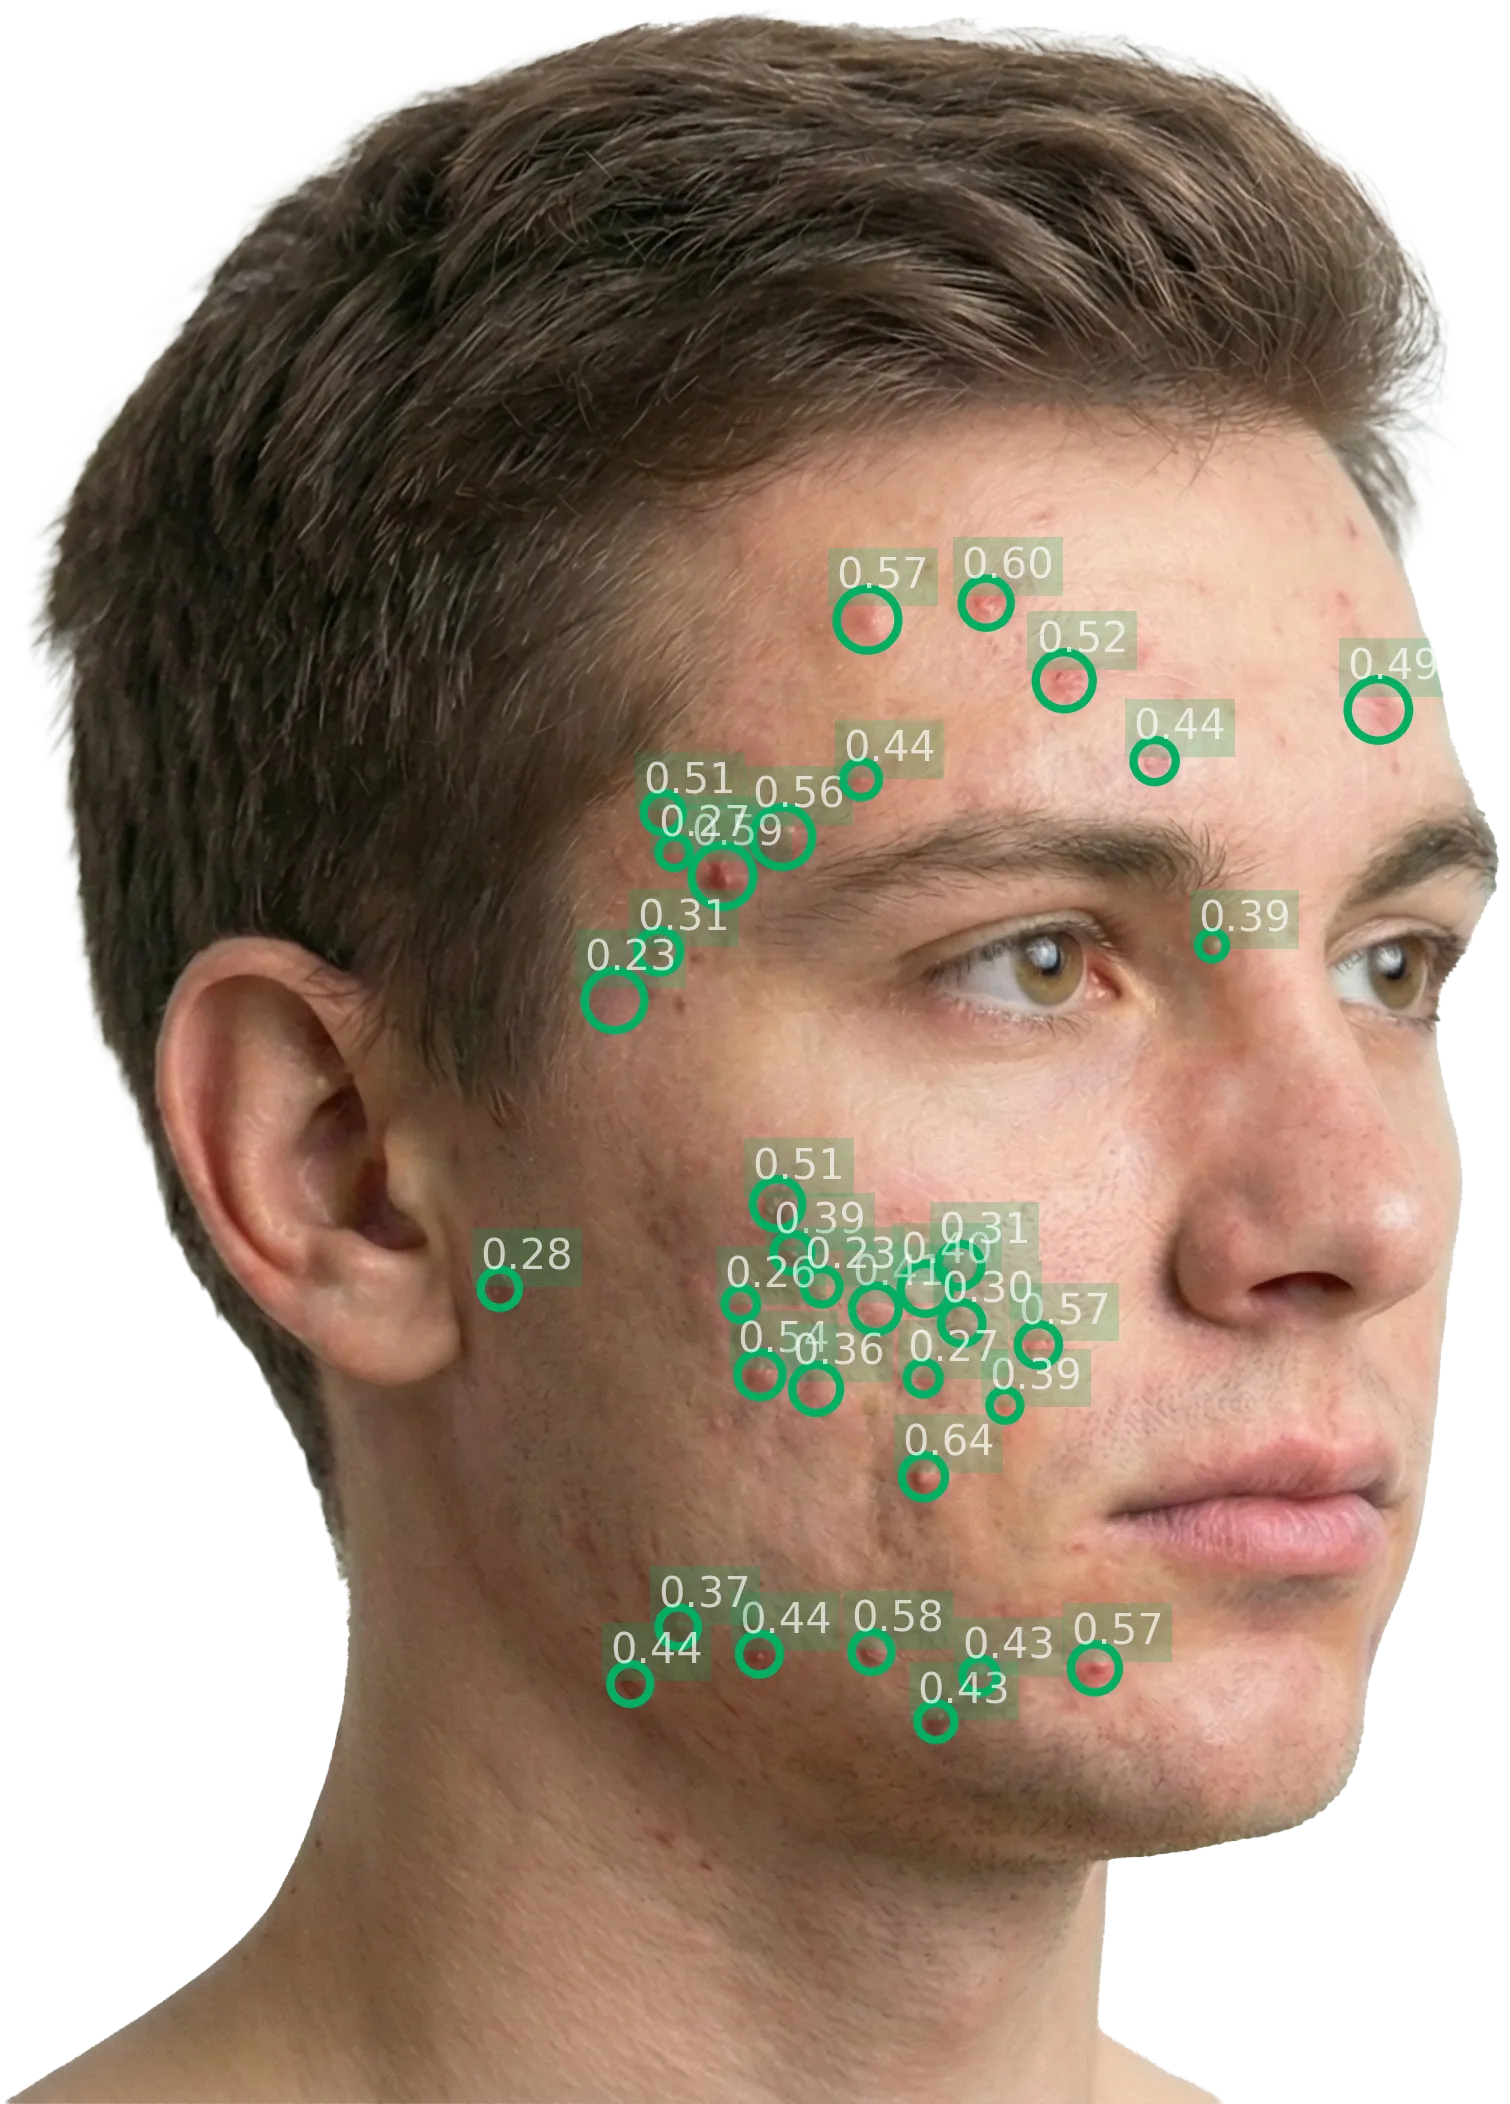
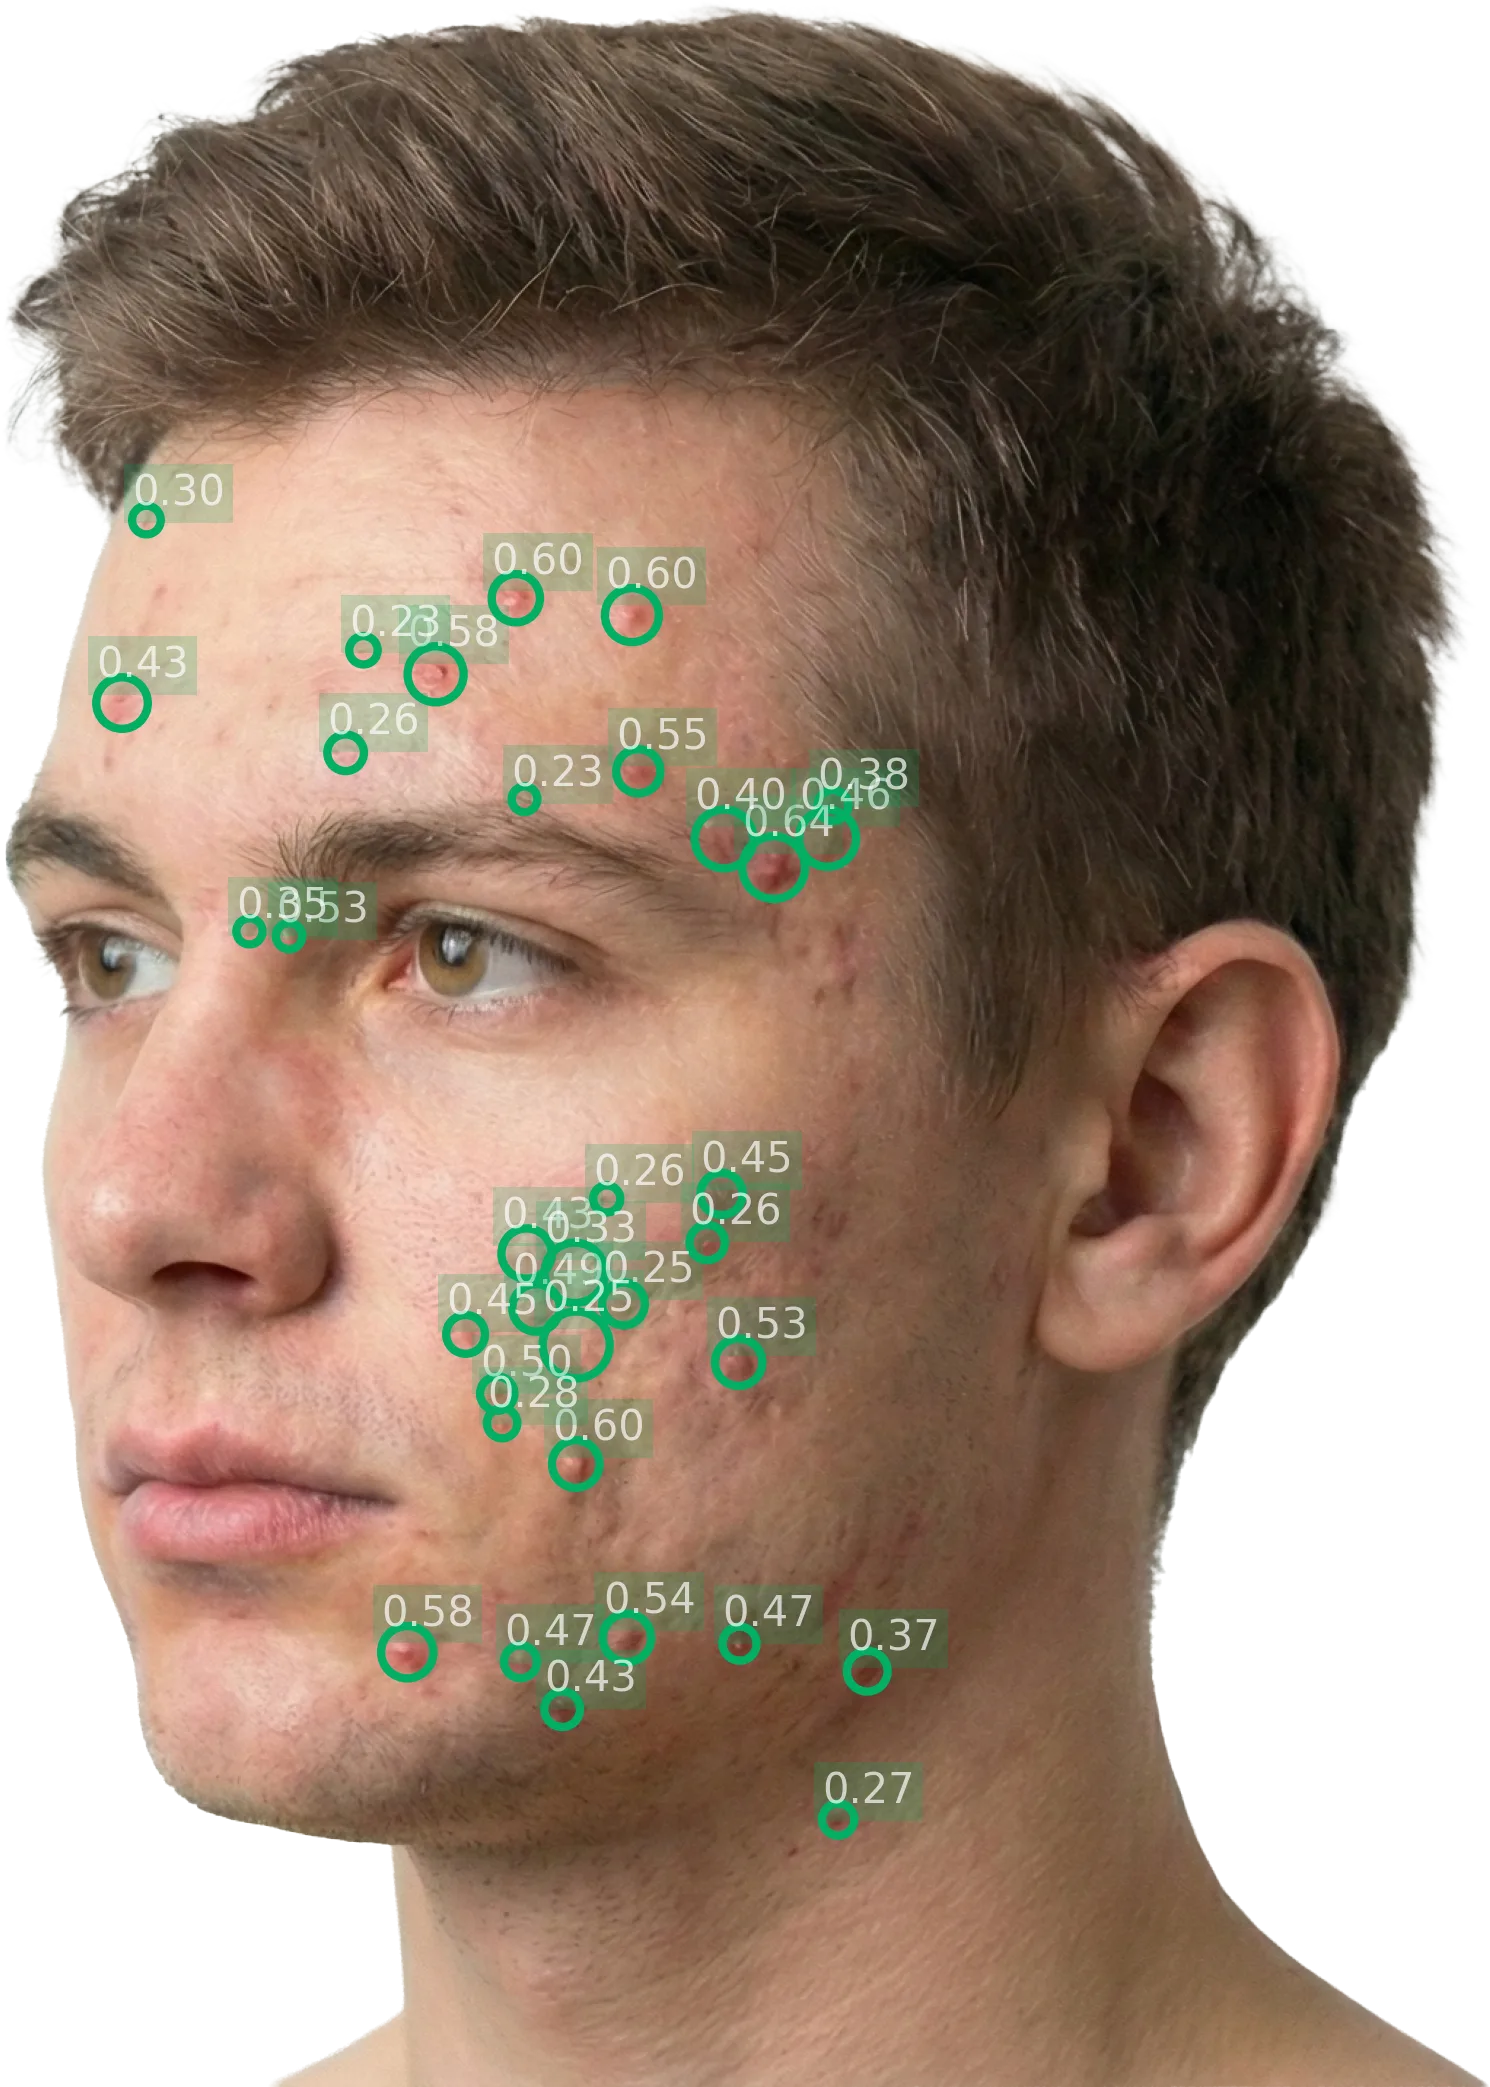
- Local scores: Further down, you can see the local scores for each perspective (left diagonal and right diagonal). Each local score shows the lesion count, density, and resulting score for that specific area.
The global score is derived by summing the two local scores.
IGA
3
ModerateAcne Lesion And Density Index
3.5
ModerateScale 0 – 4 (continuous)
Body site
Left diagonal
Image quality
92%
Lesion count
36
Density
0.55
Local score
3.42
Body site
Right diagonal
Image quality
88%
Lesion count
35
Density
0.6
Local score
3.49
Follow-up tab
Clicking on the Follow up tab will display the information about the evolution. In other words, this tab will show how the score has evolved over time comparing that visit's photos to the set of baseline images.
Clarifications tab
You can ignore this tab, as it is not relevant to the current study.
Interpret results
About the Acne Lesion And Density INdex
Through the Legit.Health platform, acne severity is assessed by taking photographs of patients' faces. These photographs are analyzed by the artificial intelligence and scored according to the Acne Lesion And Density INdex.
The Acne Lesion And Density INdex combines lesion count (the number of inflammatory acne lesions) and lesion density (how closely packed those lesions are) into a single, interpretable score.
Ranges
The global score is calculated from AI analysis of 2 uploaded facial images: left diagonal and right diagonal. Each image corresponds to a specific perspective, and the sum of both local scores yields the global score. This approach provides a comprehensive view of acne severity across the face.
Table 1: Score ranges and severity
| Score | Severity Label | Description |
|---|---|---|
| 0 | Clear | No inflammatory lesions |
| 1 | Almost clear | Rare inflammatory lesions with very low density |
| 2 | Mild | Some inflammatory lesions, may have low to moderate density |
| 3 | Moderate | Several inflammatory lesions with moderate to high density |
| 4 | Severe | Many inflammatory lesions with high density, covering significant area |
Additionally, local scores are derived for each perspective of the face (left diagonal and right diagonal). These local scores help pinpoint areas of significant acne concentration by measuring each perspective's severity on its own scale.